Karsten Lehmann 21 May 2026 11:00:00
It is the first week of January, and somebody has to write the year-end report. The numbers are scattered across three places: time records you wrote against your own contracting projects in your private MindooDB tenant, the hours you logged on the company calendar in your work tenant, and the deliveries your team booked on a shared tenant that exists for the joint project with a partner company. Each of those databases lives behind its own encryption keys, on its own server, and was perfectly happy never knowing about the others.
Until today the path from there to a tidy Excel sheet for your accountant involved exporting each side separately, opening three workbooks in Excel, copy-pasting columns into a fourth one, building a few SUMIFS over the result, and praying nothing important moved when somebody updated their numbers an hour later.
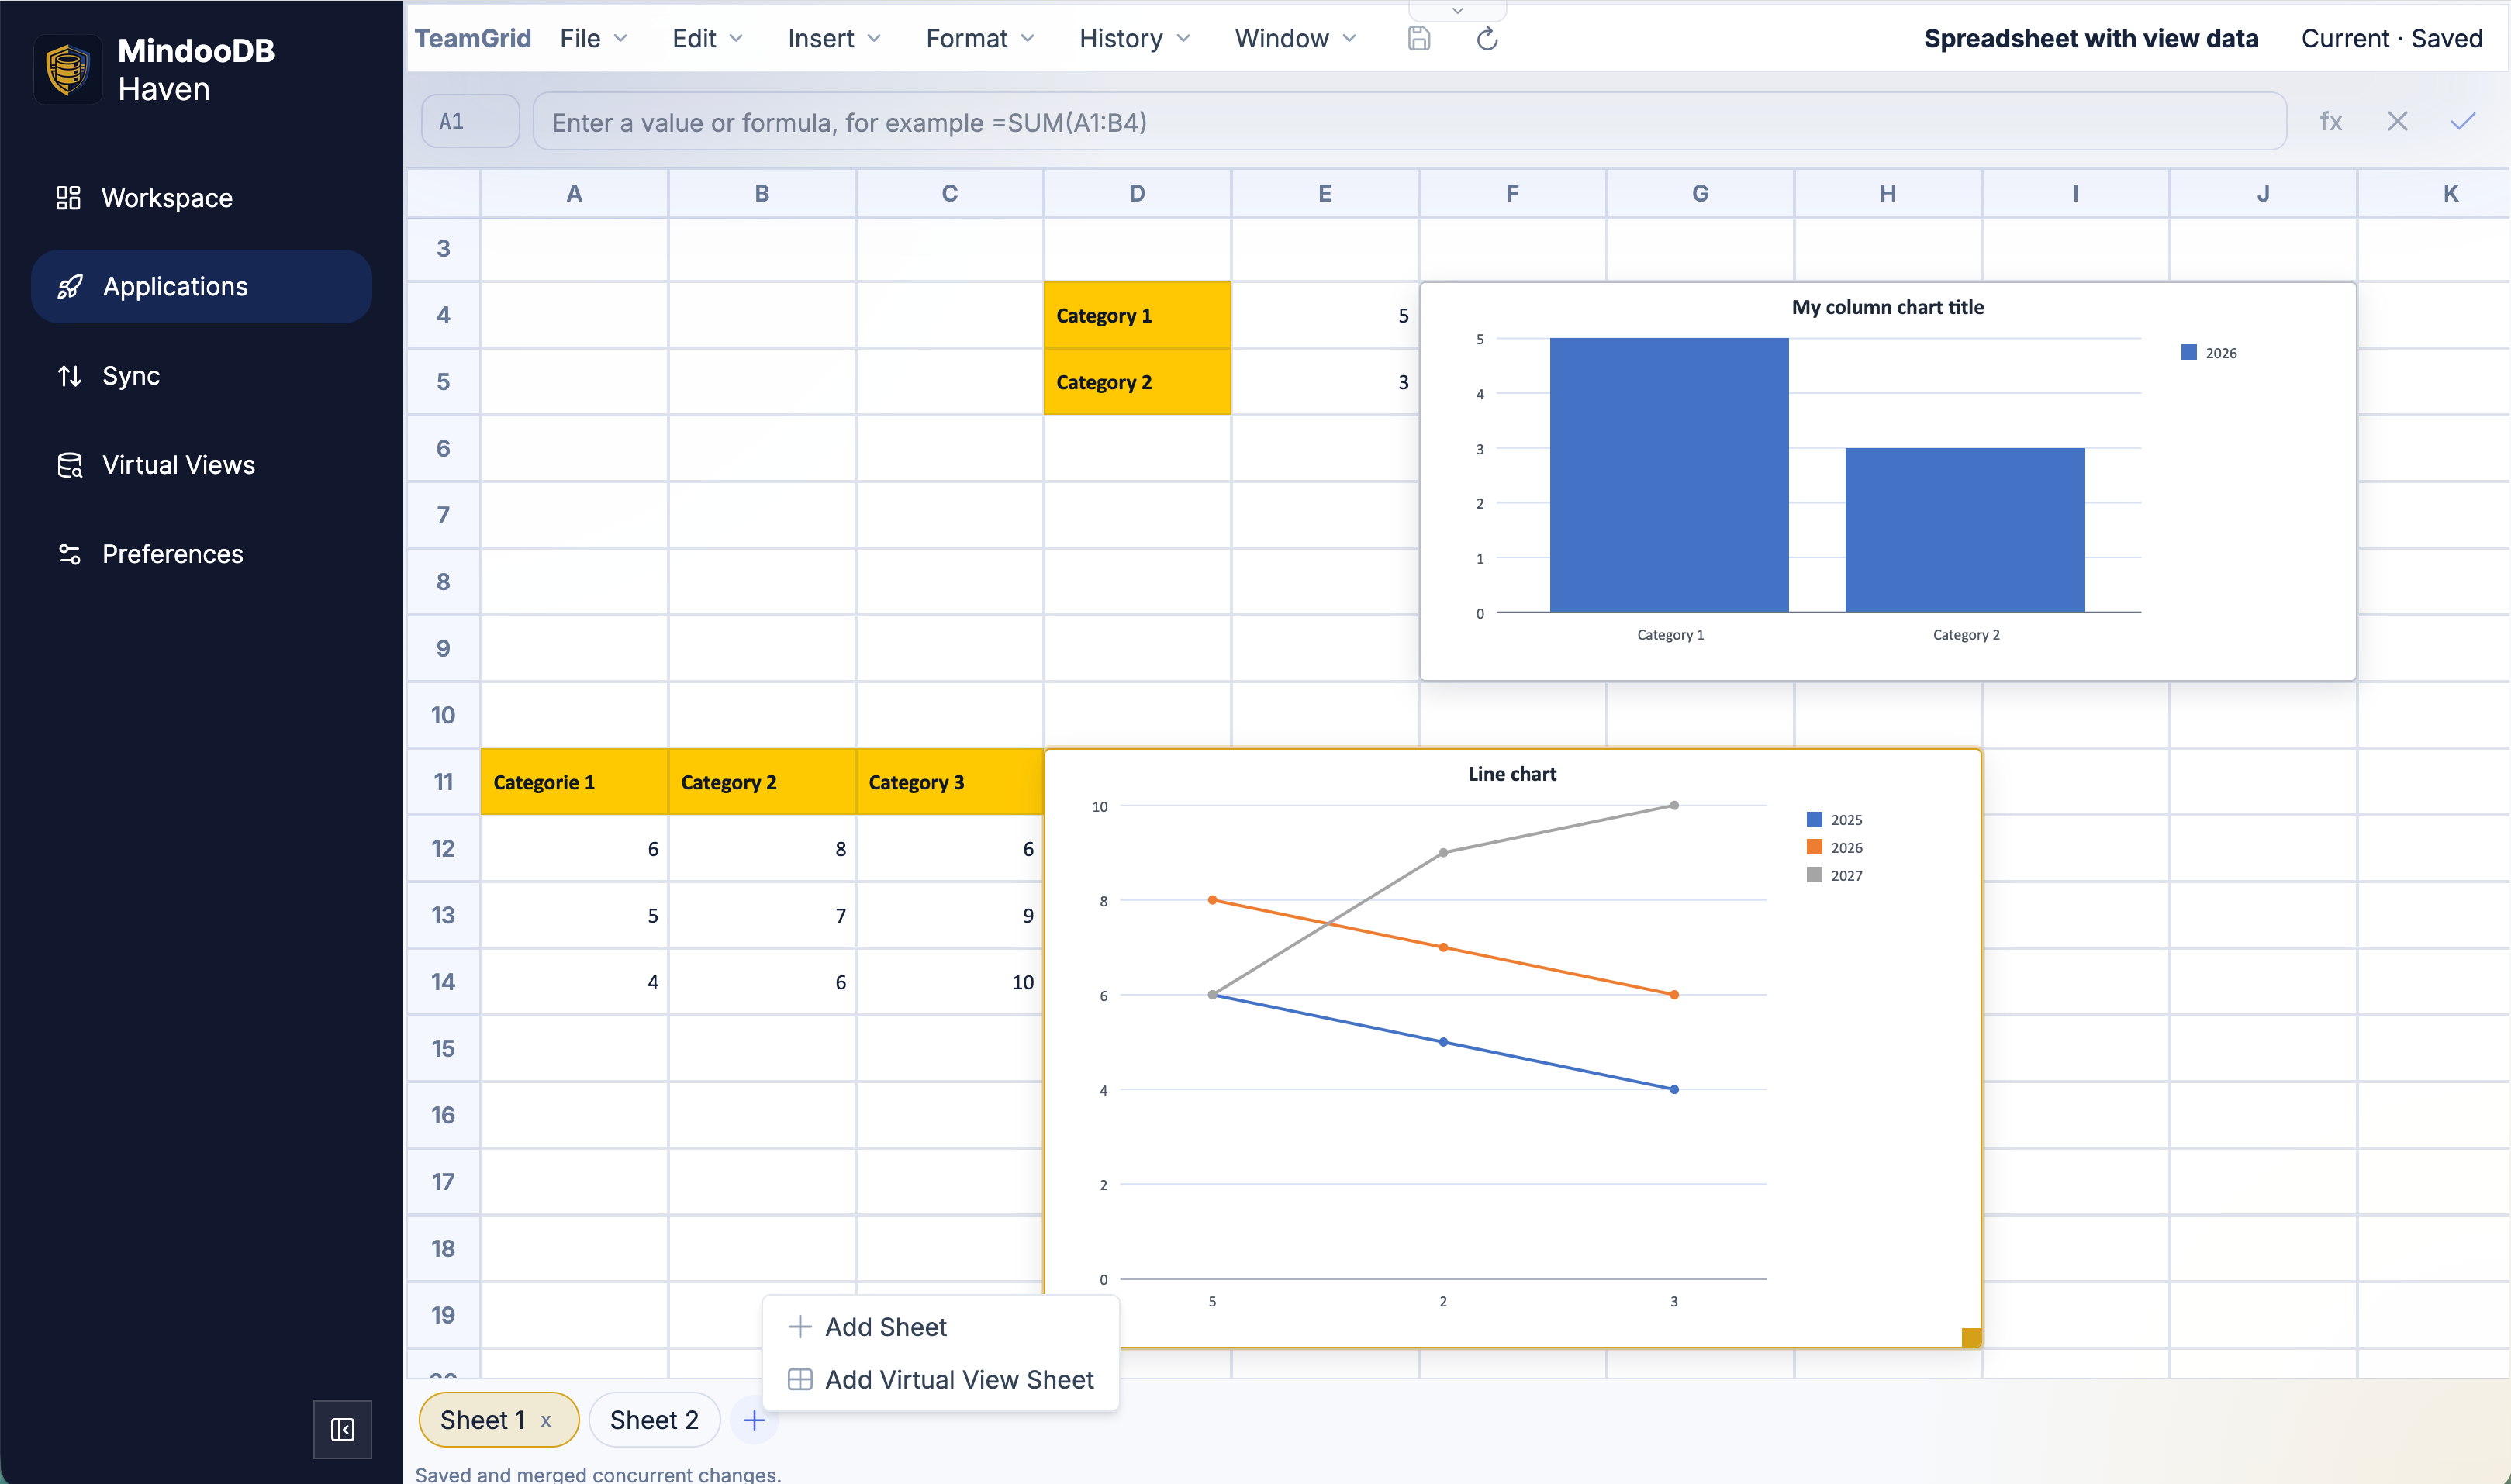
From today on, you define one virtual view in Haven that pulls from all three databases at once, open Mindoo TeamGrid, click the + tab and pick Add virtual view sheet. The view’s category tree, sorted columns, and per-category totals materialize into a regular worksheet. You write =SUMIFS(...) and =AVERAGE(...) against those cells the same way you would in any other spreadsheet, you draw a column chart over the months, and you export the whole thing as .xlsx for the accountant. When the partner company adds another batch of deliveries later that week, you click Refresh in the top-left of the sheet and the numbers update in place.
That is the big new feature in this release of Mindoo TeamGrid - the open source sample app for collaborative spreadsheets in MindooDB Haven we introduced last week. But it is not the only one. The four days between the first release and this update were spent making the rest of TeamGrid feel a lot more like a spreadsheet you can actually do work in.
Here is the full list.
Closer to Excel: cell types, selection, keyboard, hidden lines
The first batch of changes is the kind of thing nobody notices when it works and everybody notices the moment it does not.
Cell types now detect themselves. Type 42 into a cell and TeamGrid stores a number; type 21.05.2026 and it stores a date; type =A1+B1 and it stores a formula; type 12.5% and it stores a percentage with the right number format already attached. The detection mirrors how Excel treats fresh typing, so muscle memory transfers over: numbers right-align, dates right-align, text left-aligns, the formula bar shows the source rather than the rendered value. The Format cells dialog still lets you pin a cell to a specific type when you want, but for casual editing the answer is usually “just type the value and let TeamGrid figure it out”.
Selection works the way Excel users expect. The grid now tracks an active cell, a primary rectangular range, and a list of additional disjoint ranges - the same model both Excel and Google Sheets use. Click selects a cell. Drag or Shift+click extends the range. Ctrl/Cmd+click on an unselected cell pushes the previous range onto an additional-ranges list and starts a new one; Ctrl/Cmd+click on an already-selected cell removes it again, splitting the surrounding rectangle into pieces so the data stays rectangular. The same multi-selection holds cell ranges, row bands, and column bands at once, so “this column, that row, except their intersection” is a single, expressive selection. Clicking a row header or a column header selects the whole row or column; Shift extends it to a contiguous band; Ctrl/Cmd adds a disjoint one. Every operation downstream - Format cells, copy, cut, paste, the formula bar’s address indicator - iterates over the combined list, so applying a fill color to a mixed cells+rows+columns selection just works.
Keyboard handling matches Excel down to the small details. Arrow keys, Tab, Shift+Tab move the active cell and collapse a multi-selection on the way; Shift+arrow extends the primary range from its anchor; F2 enters the inline editor; Enter and Shift+Enter commit and move down or up; Tab and Shift+Tab commit and move right or left; Escape cancels; and - the one shortcut every Excel power user immediately looks for - Alt+Enter (Option+Enter on macOS) inserts a literal newline inside the cell without committing, so multi-line content like address blocks finally behaves the way it does in Excel. The formula bar honours the same shortcut.
Rows and columns can be hidden. Right-click a row or column header (or use Edit / Hide rows and Edit / Hide columns) to collapse the selected lines to zero size; select the neighbours and pick Unhide to bring them back. Useful for spreadsheets where the source data lives in a few rows nobody needs to look at every day but everybody needs to keep around. The hidden flag is preserved through XLSX import and XLSX export, so the state survives an Excel round trip in both directions.
A real formula engine: 280 functions, content assist, cross-sheet references
In the initial release TeamGrid carried a small hand-written formula engine that covered seven functions - enough to demonstrate the collaboration model, not enough to do real work.
For this release we replaced the engine behind a thin adapter with the permissively licensed fast-formula-parser. The result is about 280 Excel-compatible functions out of the box - math (ROUND, MOD, POWER, SQRT, …), statistics (COUNTIF, COUNTIFS, SUMIF, STDEV, …), text (LEFT, RIGHT, MID, LOWER, UPPER, TRIM, …), date and time (DATE, YEAR, MONTH, DAY, WEEKDAY, EOMONTH, …), logical (IF, IFS, AND, OR, NOT, …), and a lot more - plus arithmetic, comparisons, ranges, and whole-column references like A:A.
The tricky part is that TeamGrid does not actually store A1 and D7. Every cell, every row, and every column has a stable opaque ID, and formulas keep their references as those stable IDs so that an insert or a delete somewhere on the sheet does not silently retarget a totally different cell. The adapter that sits between fast-formula-parser and the document model takes care of that: visible Excel-style addresses are mapped to TeamGrid IDs at the moment a formula is parsed, and the IDs are mapped back to their current visible addresses on every render. That keeps formulas correct when two users insert rows on the same sheet at the same time (the original collaboration story) and lets you write the formulas with familiar Excel syntax in the first place.
Formula references work across worksheet tabs too. Use Excel’s sheet qualifier syntax with quotes around names that have spaces or punctuation - =SUM('Sheet 2'!A1:C1) - or the friendlier unquoted form while editing - =SUM(Sheet 2!A1:C1). TeamGrid normalizes back to the quoted form for display and for XLSX export, and the cross-sheet reference is stored using the target worksheet’s stable ID, so it tolerates sheet renames and row or column insertions in the other sheet.
While you type, Ctrl+Space (or the fx button next to the formula bar) opens content assist: a scrollable, filterable list of available functions, with their signature, a short description, and hover details. Pick one with the arrow keys, press Enter, and the function name and opening parenthesis are inserted at the caret. The referenced cells and ranges of the formula you are authoring are highlighted live on the grid, so it is immediately obvious whether the range you are about to capture is the one you actually meant.
Charts: Column, Bar, Line, Pie
You can now insert charts. Specifically the four chart types we hear asked for over and over again from Excel users: Column (vertical bars), Bar (horizontal bars), Line, and Pie.
Charts are first-class objects on a worksheet, stored beside the cells. Each chart has a two-cell anchor on the sheet (so you can drag it around), a chart type, an optional title, a legend, a category-axis range, and one or more value series with name, range, and optional color. Select a range, open Insert and pick a chart type, and TeamGrid infers the category labels and the value series from the layout of the selection (header row or header column when present). Double-click a chart - or open Chart properties - to change the title, the type, the data range, the per-series names, values, and colors, the legend position, the palette, and the value-axis gridlines.
Charts round-trip through XLSX. Importing a workbook that has charts in it brings the charts into TeamGrid with their data references mapped to the stable-ID schema; exporting writes them back into the workbook’s OOXML drawing parts, so a recipient who opens the file in Excel sees the same chart you drew. And because charts reference cells by stable IDs underneath, the chart that points at last month’s totals keeps pointing at the same totals after a teammate inserts three new rows above them on a phone over lunch.

Spreadsheet templates and “File / New from template…”
Any TeamGrid spreadsheet can now be marked as a template. Open Spreadsheet properties and toggle Use this spreadsheet as a template; the flag is stored as a property on the document the same way the title and tags are, so the change merges cleanly with concurrent edits to the other properties.
Once a workbook is a template, three things happen.
First, the File / Open dialog grows a Spreadsheet type selector with three modes - All, No templates, and Only templates. The default is No templates so the everyday Open list stays focused on real workbooks. Each mode is backed by its own virtual view filter, so the category tree, the document counts, and the tag fan-out stay consistent across modes without TeamGrid having to filter rows on the client.
Second, the File menu adds New from template…. It opens the same Open dialog locked into Only templates mode, with the confirm button renamed to Create. Pick a template, press Create, and TeamGrid clones the template into a new spreadsheet titled Copy of <template title> with the template flag cleared, ready to save into any database your registration has write access to.
Third, templates synchronize and time-travel like every other document. A team can keep a folder of project, quote, and timesheet templates in a tenant, share them through Haven’s regular sync, and pin an application time travel snapshot to last quarter to see what the templates looked like back then.
Better XLSX round-tripping
The first TeamGrid release already imported and exported .xlsx workbooks for values, formulas, simple number and date formats, fonts, fills, and alignment. This release rounds that out in a number of places.
Imported workbooks now keep more of their formula content (every function the new engine recognises), the new chart types (Column, Bar, Line, Pie), the hidden state of rows and columns, custom row heights and column widths, and per-edge cell borders with their style and color. The five most common Microsoft fonts that show up in real-world workbooks - Calibri, Cambria, Courier New, Arial, and Times New Roman - are aliased through metric-compatible Croscore replacements (Carlito, Caladea, Cousine, Arimo, Tinos) at render time, so a workbook authored in Excel on Windows still has stable column widths and line heights when it is opened later in TeamGrid on macOS, Linux, or a phone. None of that requires the original Microsoft fonts to be installed.
Export does the same in reverse. A workbook saved out of TeamGrid into Excel keeps its charts, hidden lines, borders, and number formats, so collaboration that starts in MindooDB and ends in Excel - or starts in Excel and continues in MindooDB - is no longer a one-way trip.
The big one: Virtual View Sheets
Which brings us back to the year-end report.
Virtual views are Haven’s analytical surface. A view filters, categorizes, sorts, and totals documents across one database, several databases, or several tenants at once. A view can have category columns to group and drill down into, sorted columns, computed totals, and per-category document and descendant counts. Because views can span tenants, a single view can combine private data with work data, mix in data from a tenant shared with a partner company, and present the result as one consistent tree. That cross-tenant story is one of the things people tend to bring up first when they realise Haven is genuinely multi-tenant rather than single-tenant-with-switching.
What was missing until today is a way to take that combined data and do something with it inside a spreadsheet: write formulas over it, draw a chart on top, send it to an accountant as a real .xlsx file. Virtual views in Haven could already export the selected rows of a result tree to Excel, but the moment a number needed to be summed, averaged, or visualised, it had to leave the platform.
The new Virtual View Sheets in TeamGrid close that gap. Open a workbook, click the + icon on the worksheet tabs, and the menu now offers Add Virtual View Sheet alongside the existing Add Sheet.
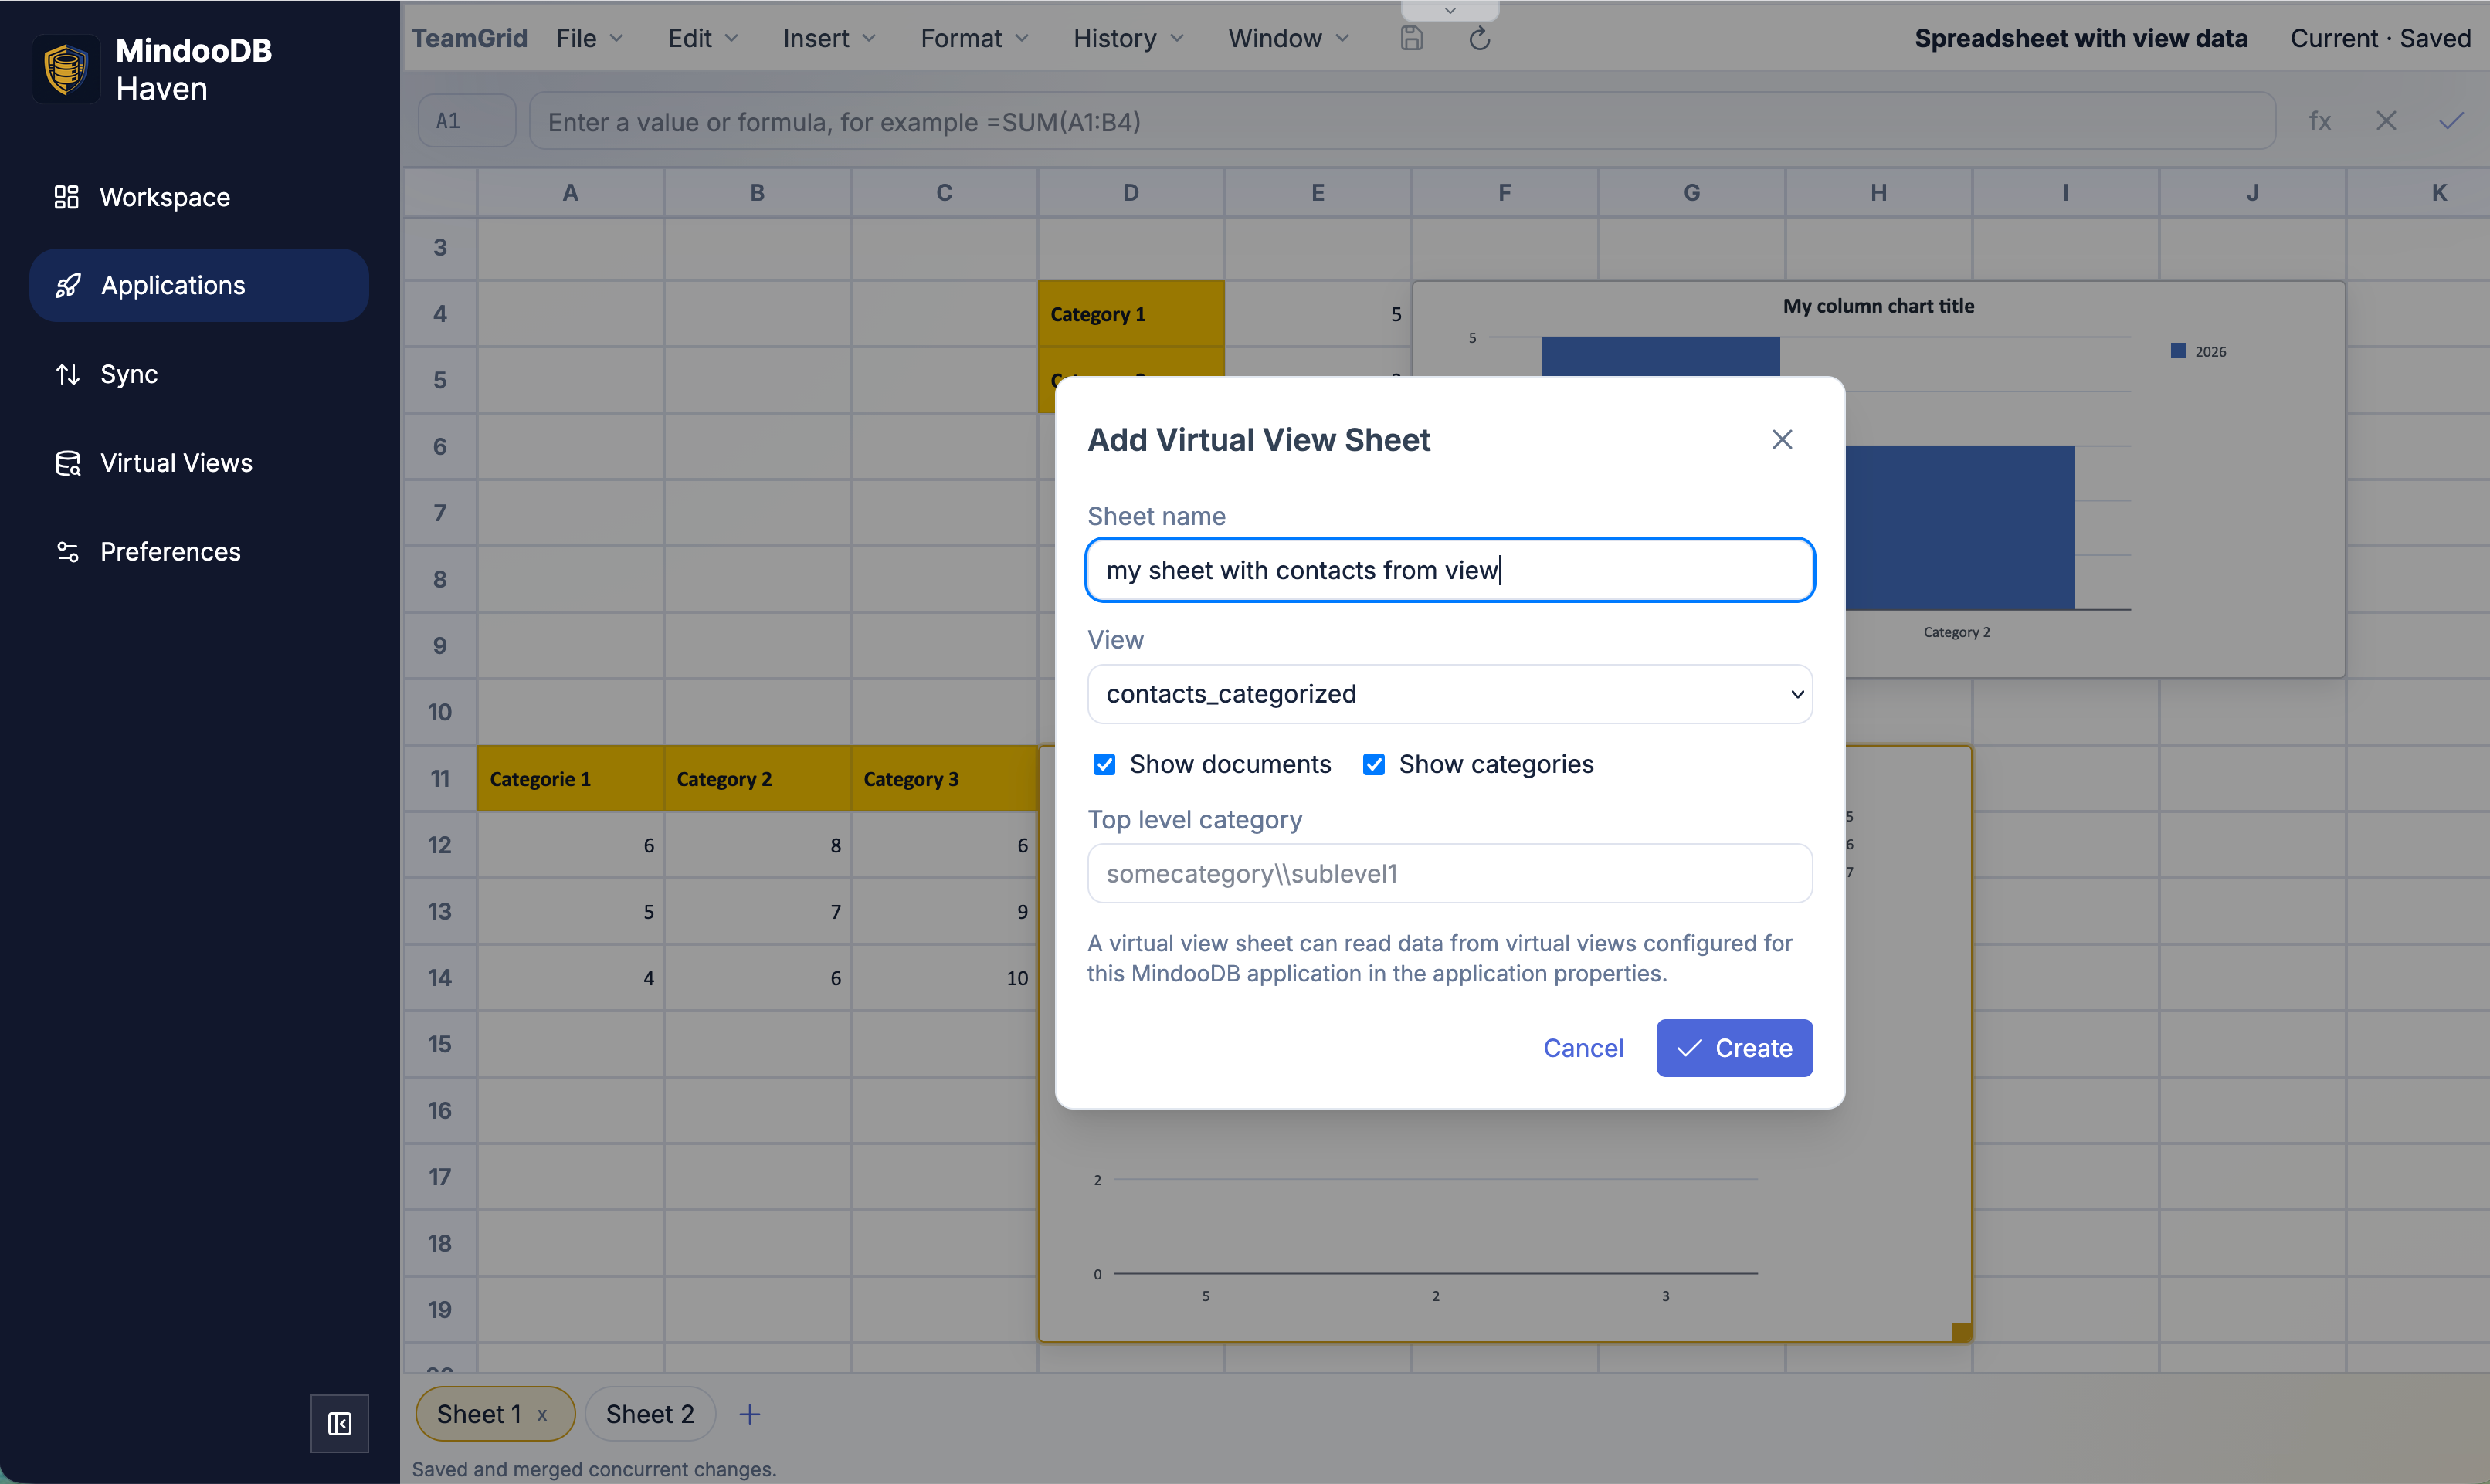
The dialog lets you pick:
- One of the virtual views configured for the TeamGrid application in Haven.
- A worksheet name.
- Whether the sheet should show categories, documents, or both (so you can choose between “just the totals” and “every detail row”).
- An optional top-level category path so the sheet covers, for example, just one year, or just one project’s time records.
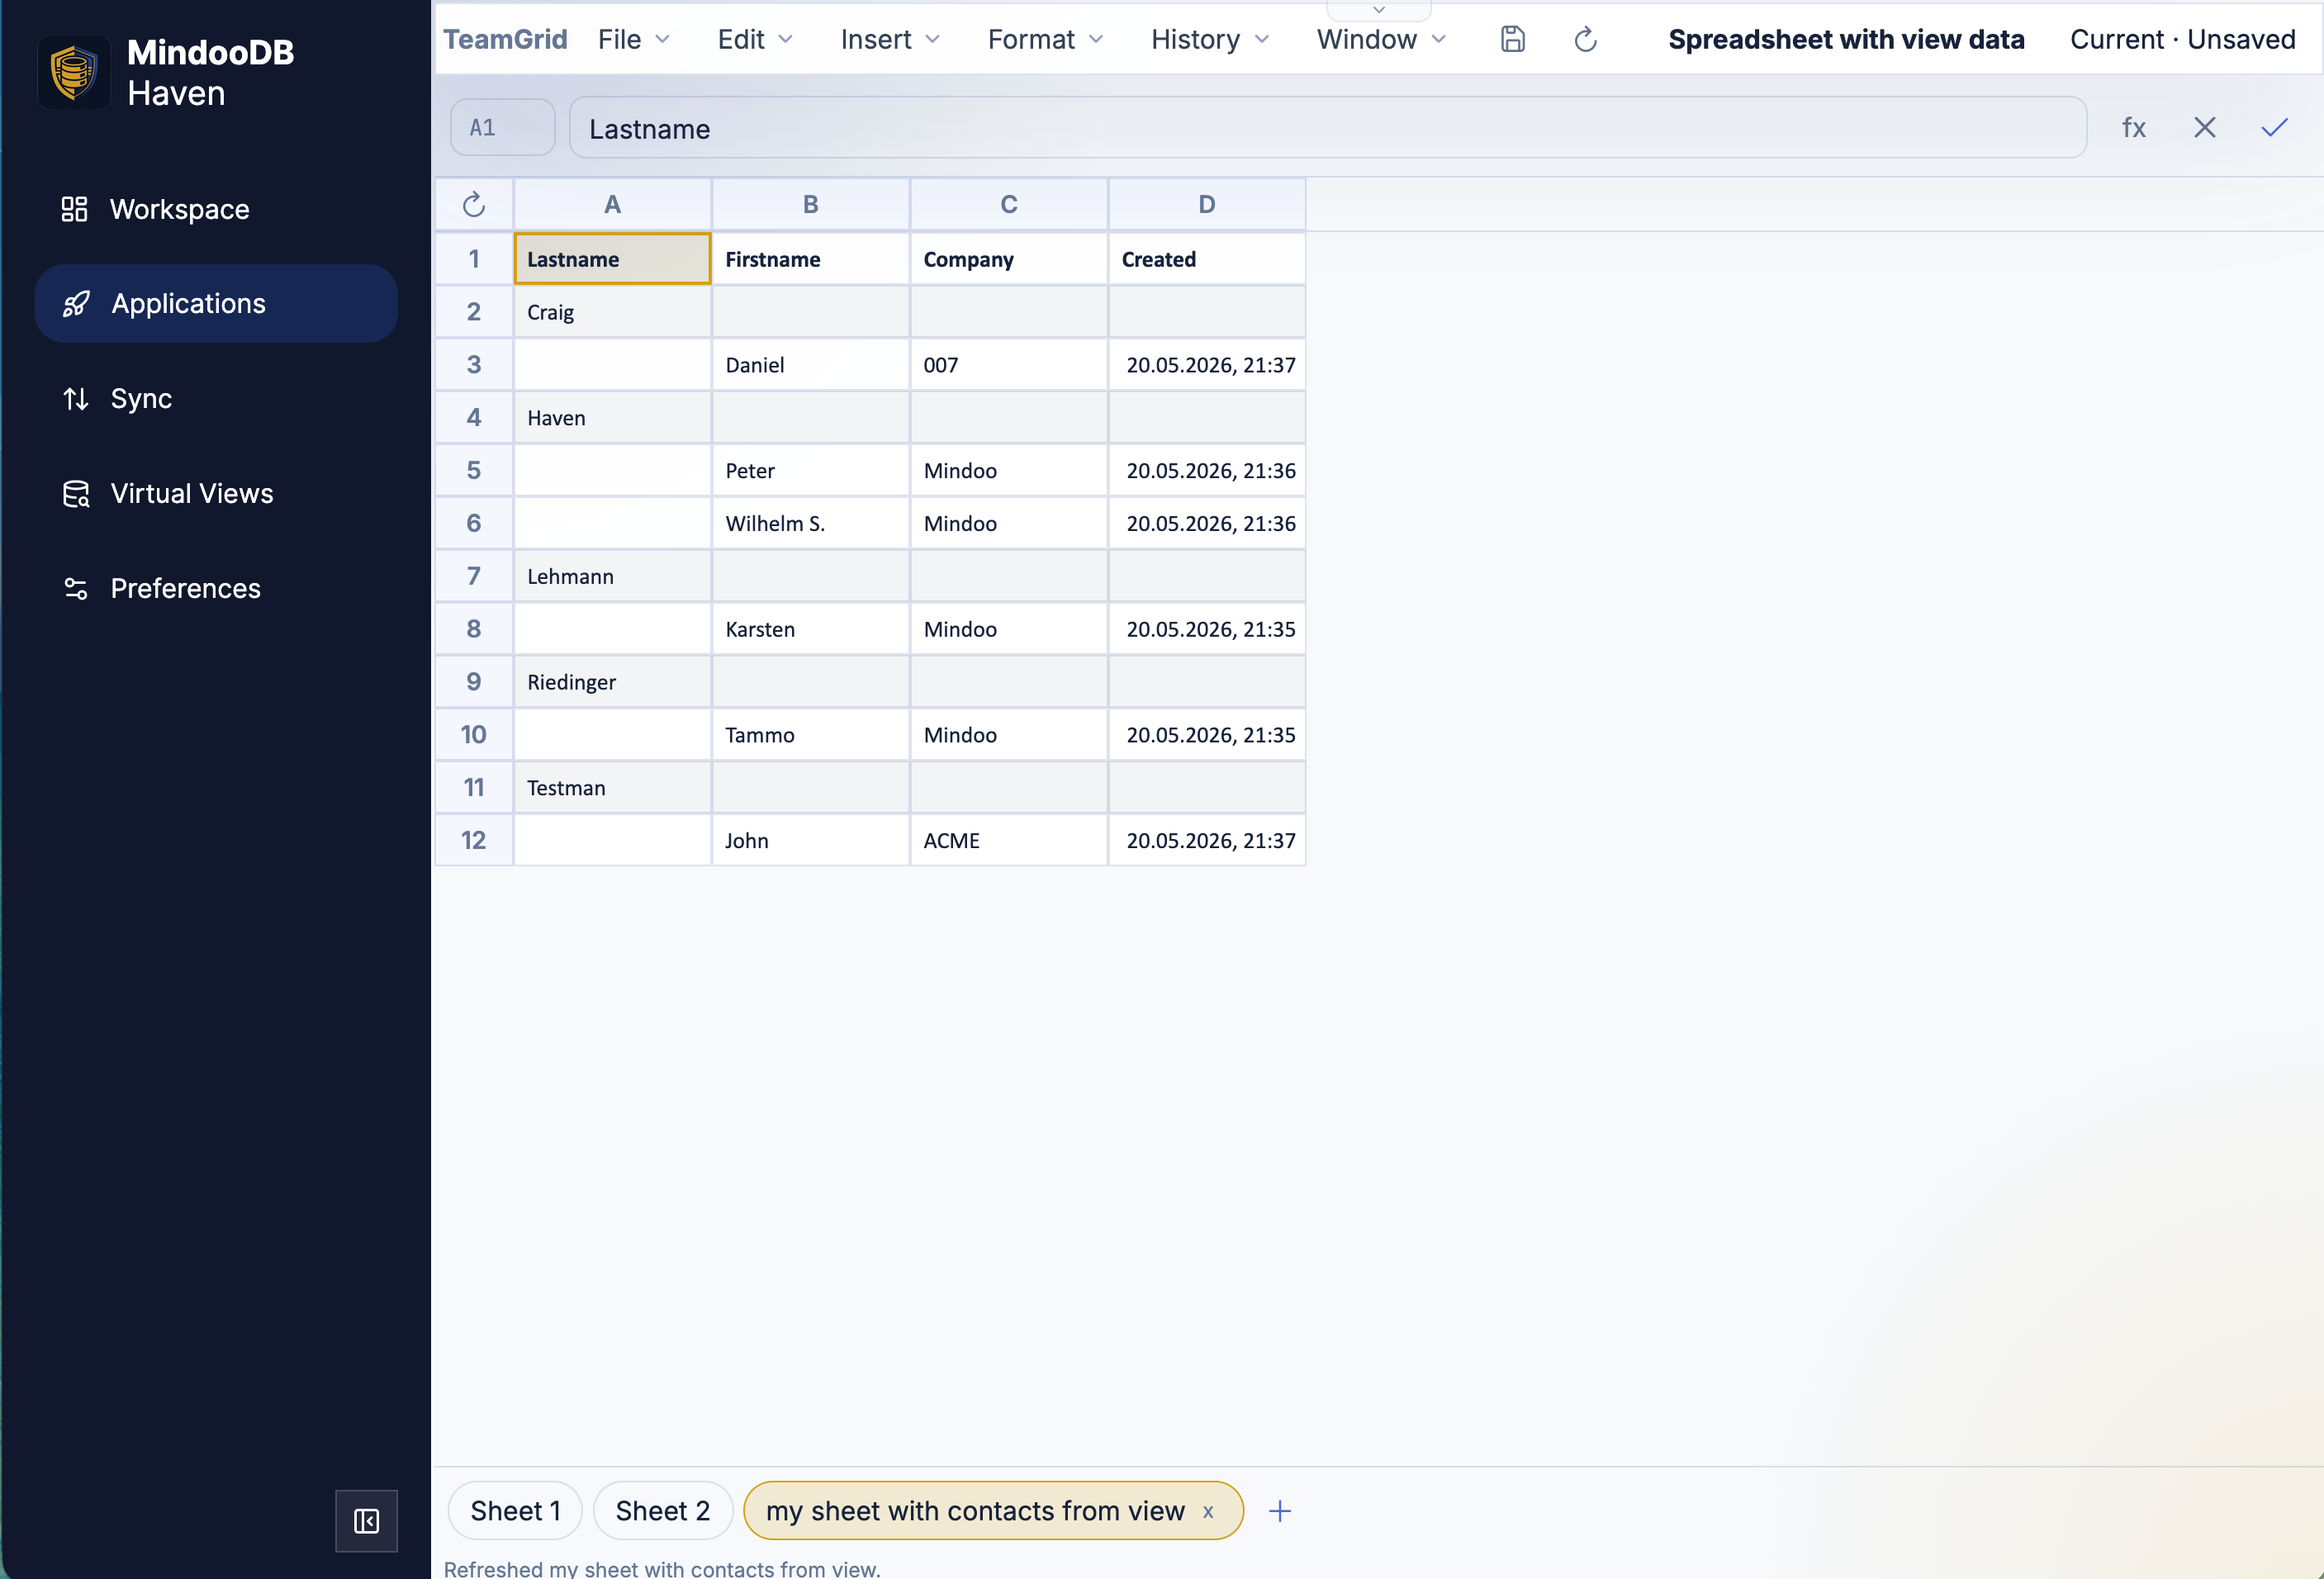
Confirm, and TeamGrid walks the view, projects each category and document row into a worksheet row, and writes the view’s columns into ordinary cells. The category columns end up on the left so you can drill down visually; the totals and counts the view already computed (v.childCount(), v.descendantDocumentCount(), …) end up as numbers in their own cells; the sorted columns stay sorted. From the cell’s point of view there is no special “live view” cell type - the values are just numbers, strings, and dates, written into the worksheet the same way you would write them yourself.
That sameness is the trick. Once the data is in the sheet, every other TeamGrid feature simply works on top of it:
- Standard Excel formulas can reference view rows by ordinary range syntax.
=SUMIF(B:B; "Travel"; D:D)adds up every travel cost row in the view;=AVERAGEIF(...),=COUNTIFS(...), and the rest of the 280-function library do the same. - Charts can be drawn over the view’s rows. A column chart over a year of monthly time-record totals is a couple of clicks.
- The sheet exports cleanly as
.xlsx. Because the data is real cells, the recipient does not need MindooDB to open the file - they just see the values, the formats, and the charts the way you saw them at the moment of the last refresh. - The sheet participates in revisions, time travel, undo, and the granular concurrent-edit machinery. Last quarter’s view-driven report can be re-opened with the same application time travel snapshot that drove the live workbook back then.
A small Refresh button in the top-left of the worksheet re-runs the view at any moment. The row, column, and cell maps are rewritten in place, the worksheet’s refresh timestamp is updated on the document, and the status bar at the bottom confirms which sheet was just refreshed - so a future version of TeamGrid can light up a “stale” indicator off the persisted timestamp without changing the data model. Manually edited cells in a view sheet are intentionally overwritten on refresh - the source of truth is the configured virtual view, and that is the contract that makes the sheet trustworthy.
Because the materialized values are persisted into the MindooDB document, the sheet keeps working offline. You can spend an entire flight working on totals and charts over the view’s last refresh state, and the next sync simply replicates the workbook along with everybody else’s documents.
And it still merges, automatically
A reminder, because it remains the point of the whole exercise: every change in a TeamGrid workbook - typing in a cell, formatting a range, inserting a row, hiding a column, marking the spreadsheet as a template, dropping in a chart, adding a Virtual View Sheet, pressing Refresh - is sent to Haven as a small granular operation against the document version the user actually saw. Haven applies and merges those operations against the real Automerge document on its side, the same machinery TeamGrid was built around from the start.
That means two users on two laptops can keep working on the same workbook offline, on a train and in an office, while the same user keeps a third copy open embedded in Haven and a fourth on their phone, and when everybody syncs back the merged workbook is consistent across all four sessions - cells, rows, columns, sheet tabs, formulas, charts, hidden state, template flag and all. The harder cases - two users inserting different rows on the same sheet, two users editing different cells in the same row, one user adding a chart while another rewrites the values it points at - are exactly the cases the stable-ID document model and the granular JSON patch save path were designed to handle.
The same machinery also covers two people inserting rows or columns at the same time. The row order list is an Automerge list of stable IDs, two listInsert operations against the same baseHeads interleave cleanly instead of fighting over a position, and every formula and chart that references those IDs keeps pointing at the cells the author meant.
How to get it
If you already have TeamGrid registered in Haven, the app updates itself the next time you launch it - the registration is the same. If you do not, the fastest way is to open Applications in Haven, press New and pick TeamGrid from the example presets: one click registers the app, picks a database for it, and opens an empty workbook so you can start typing immediately.
The source code is on GitHub and is intentionally readable rather than feature-complete, so it doubles as a tutorial for building Haven apps that need granular structured editing:
https://github.com/klehmann/mindoodb-app-teamgrid
We will keep growing TeamGrid - virtualized large sheets, conditional formatting, more chart types, richer Excel round-tripping are on the list.
And if your year-end report is still three Excel files taped together, this might be a good week to try one virtual view, one TeamGrid workbook, and one Add virtual view sheet click instead.